

It is well known that colour changes with pH; most famously litmus is used as the "acid test" changing from red to blue when a solution becomes alkaline. The multi-billion dollar paints, pigments and dyestuffs industry relies upon exploiting the chemistry of colour to make new and improved products.
In this example, we demonstrate how to use the associated changes in the UV-visible spectrum of a compound upon ionisation in order to establish its acidity constant (pKa).
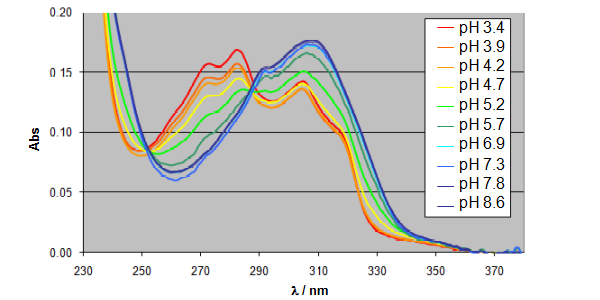
The series of UV-visible spectra below show the response of the vinyligous acid warfarin to changing the pH of the buffer solution in which the spectrum is recorded (all solutions are 5 % v/v methanol).
We know that the equilibrium relationship between the protonated and unprotonated forms of a molecule is defined as a function of pH as follows:
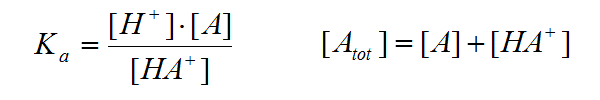
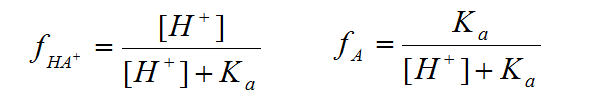
With a little algebra we can deduce the fraction of each form present:
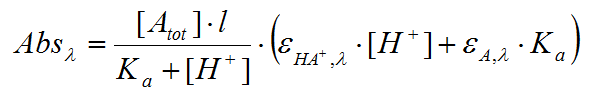
The Beer-Lambert law gives the dependence of UV-visible absorption upon extinction co-efficient, concentration and path length:

Given that the absorptions of different species' in solution are additive, we can combine all of these equations to give us an expression for the total absorption of an ionising species as a function of pH, pKa and the extinction co-efficients of the protonated and unprotonated forms:
We could therefore use this equation and a data-set of absorption responses in a series of buffer solutions, keeping the total concentration of our ionising species constant, in order to determine the pKa. This approach is problematic since small changes in concentration can introduce significant 'noise' into the data, making the position of the ionisation in the Absorption / pH profile unclear.
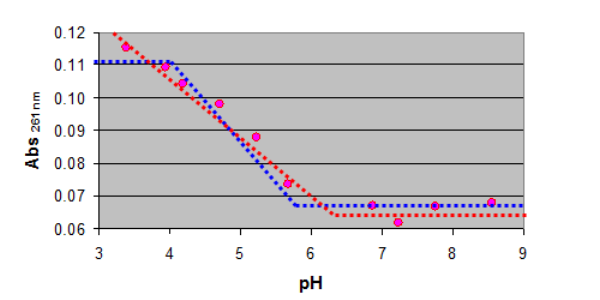
This problem may be overcome by normalising for any differences in concentration: the ratio of the absorptions at two different wavelengths gives a response that is independent of concentration.

The above equation can now be fitted to the normalised Absorption / pH profile allowing the pKa to be calculated.
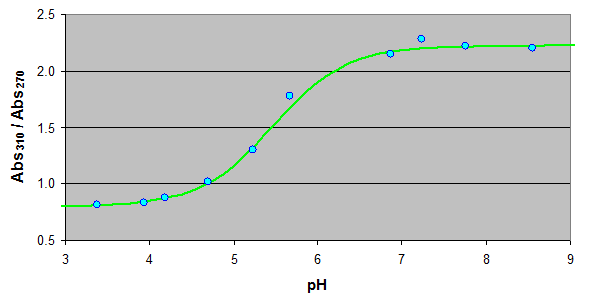
The above graph illustrates an example of pKa determination via a four-variable minimisation on ten data-points. This is acceptable since the form of the curve is rigorously derived from theory. It is important to note that selection of appropriate wavelengths can have a large impact upon the signal-to-noise ratio of the determination. We have successfully applied this approach in a more-automated fashion to determining pKa on a number of compounds simultaneously in a 96-well plate. Many thanks to Dr Kin Tam of AstraZeneca PLC for his assistance with automation and data processing.

© Chemagination Ltd (2009) all rights reserved.


